Posts: 51
Threads: 2
Joined: Sep 2023
Gender: Undisclosed
Y-DNA (P): R-M222 > R-BY198
mtDNA (M): U8a1a
Country: 
02-07-2024, 12:54 AM
(This post was last modified: 02-07-2024, 01:09 AM by Cejo.
Edit Reason: added a link
)
A post by @ alanarchae in one of the Bell-Beaker threads got me digging around for some good paleoclimatology data, and I found a site that may be of interest to folks around here:
https://lipdverse.org/project/temp12k/
Also available here:
https://www.ncei.noaa.gov/access/paleo-s...tudy/27330
From the website:
Introduction
The Temperature 12k database was compiled to facilitate the study of multidecadal- to millennial-scale changes in climate over the past 12,000 years. This is a dynamic compilation, meaning that new datasets that meet the criteria for inclusion can be added and included in subsequent versions.
And here is a paper about the database:
https://www.nature.com/articles/s41597-020-0445-3
Posts: 137
Threads: 13
Joined: Oct 2023
Thank you for posting!
Temporal and seasonal availability for the past 12k years together with the method of records (pollen, isotope, etc.) is an interesting information.
Also that in the past 1000 years there seems to be less data/studies available.
Supporting sciences for human prehistory are important and it seems there is not enough public and collaborative effort available, for example shorelines, ice sheet mapping, vegetation, etc.
JMcB, JonikW, Cejo like this post
---
Main Projects: Tyrol DNA, Alpine DNA, J2-M172, J2a-M67, J2a-PF5197, ISOGG Wiki, GenWiki; Focus on Y-DNA: J2a-M67-L210, J2a-PF5197-PF5169, R1a-M17, R1b-U106-Z372
Posts: 51
Threads: 2
Joined: Sep 2023
Gender: Undisclosed
Y-DNA (P): R-M222 > R-BY198
mtDNA (M): U8a1a
Country: 
(02-07-2024, 07:41 AM)ChrisR Wrote: Also that in the past 1000 years there seems to be less data/studies available.
Supporting sciences for human prehistory are important and it seems there is not enough public and collaborative effort available, for example shorelines, ice sheet mapping, vegetation, etc.
I think climate studies focused on the past 1000 years might use different proxies, such as tree-rings, human records and such. Models are also used widely. I'm pretty sure that information and those studies are out there, just not the focus of this particular collection. I'm not sure if there is an analogous collection that is similar to this one.
I'm even less familiar with ancient shoreline, ice sheet mapping and vegetation, but it would be interesting to see if there are any collections out there for that information.
JMcB and ChrisR like this post
Posts: 137
Threads: 13
Joined: Oct 2023
02-07-2024, 06:36 PM
(This post was last modified: 02-07-2024, 06:37 PM by ChrisR.)
Regarding LGM paleoenvironment of Europe - Map
I found https://crc806db.uni-koeln.de/dataset/sh...449850675/
Quote:Abstract
The here documented GIS map and dataset contains a collection of Last Glacial Maximum (LGM, ~21k yBP) paleoenvironmental data. It is the first result of a project that aims to acquire, produce and publish GIS datasets from non-GIS based sources such as analogous maps, textual informations or figures of scientific publications for prehistoric time slices. In combination with modelling results and already available GIS-datasets related to the mentioned time frame, it should enable other researchers and members from other projects to use the maps in their work, properly cited and referenced. The map shows LGM land ice sheets, paleo-stream networks and inland water in Europe, a sea-level adapted (-120m) land mass and a Köppen-Geiger climate classification derived from climate model data.
However there is only a PDF linked with a map image included.
So no GIS dataset which may be used with tools like Google Earth.
Also this not a more comprehensive / collaborative effort which is open to update with submitted studies, which I assume would give great improvements and likely variations from subcontinental studies.
If there is a public reusable GIS map dataset about LGM (an later) with ice sheets, shore lines (land mass) and possibly additional data (vegetation, climate) I would be very interested.
Cejo and miquirumba like this post
Posts: 51
Threads: 2
Joined: Sep 2023
Gender: Undisclosed
Y-DNA (P): R-M222 > R-BY198
mtDNA (M): U8a1a
Country: 
(02-07-2024, 06:36 PM)ChrisR Wrote: Regarding LGM paleoenvironment of Europe - Map
I found https://crc806db.uni-koeln.de/dataset/sh...449850675/
Quote:Abstract
The here documented GIS map and dataset contains a collection of Last Glacial Maximum (LGM, ~21k yBP) paleoenvironmental data. It is the first result of a project that aims to acquire, produce and publish GIS datasets from non-GIS based sources such as analogous maps, textual informations or figures of scientific publications for prehistoric time slices. In combination with modelling results and already available GIS-datasets related to the mentioned time frame, it should enable other researchers and members from other projects to use the maps in their work, properly cited and referenced. The map shows LGM land ice sheets, paleo-stream networks and inland water in Europe, a sea-level adapted (-120m) land mass and a Köppen-Geiger climate classification derived from climate model data.
However there is only a PDF linked with a map image included.
So no GIS dataset which may be used with tools like Google Earth.
Also this not a more comprehensive / collaborative effort which is open to update with submitted studies, which I assume would give great improvements and likely variations from subcontinental studies.
If there is a public reusable GIS map dataset about LGM (an later) with ice sheets, shore lines (land mass) and possibly additional data (vegetation, climate) I would be very interested.
I took a quick through the citations from there, and it looks like some of the datasets they used are available. For example, climate classification shapefiles ( https://crc806db.uni-koeln.de/dataset/sh...imulation/).
I'll dig through some more as I get a chance, but that CRC806 collection looks very promising, at least for Europe. It may take some digging, and some of it may require using something like QGIS to visualize shapefiles. Some of it may also require recreating methods they describe (for example, if I read this right, I think they combined bathymetry with LGM sea level to recreate a coastline).
Posts: 51
Threads: 2
Joined: Sep 2023
Gender: Undisclosed
Y-DNA (P): R-M222 > R-BY198
mtDNA (M): U8a1a
Country: 
02-08-2024, 12:51 AM
(This post was last modified: 02-08-2024, 01:28 AM by Cejo.
Edit Reason: More detail after exploring
)
I asked Chat-GPT, and it may have pointed me towards a good source for this kind of data: NOAA NCEI (which I probably should have known)
https://www.ncei.noaa.gov/products/paleoclimatology
Ultimately, figuring out how to best use the Paleo Data Search seems like an important way to find the right datasets.
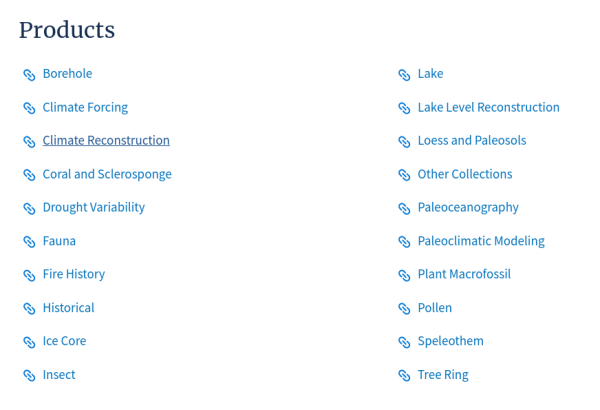
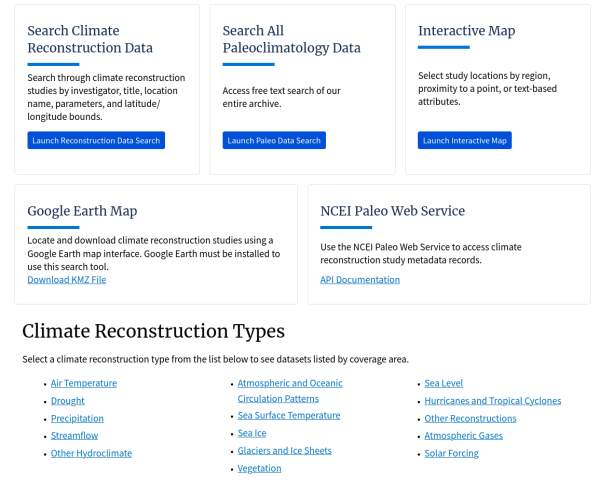
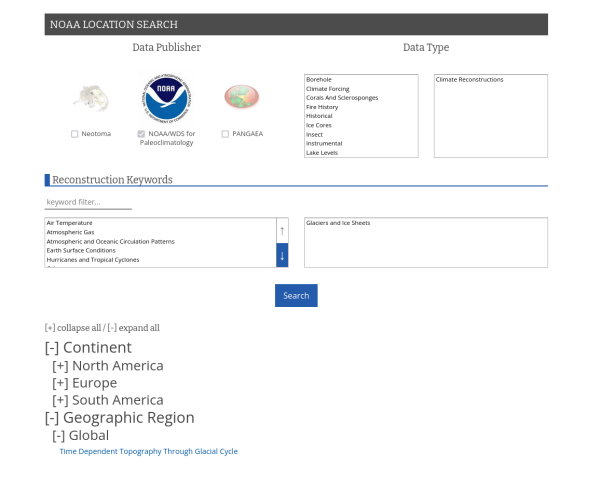
However, I found the links in the Products area to be a little quicker and more intuitive, since I knew what I was looking for. For example, selecting Climate Reconstruction took me to https://www.ncei.noaa.gov/products/paleo...nstruction, where I selected the Glaciers and Ice Sheets link, which narrowed the Paleo Data Search down for me. Then I just selected the Glaciers and Ice Sheets Keyword, and from there found time-dependent ice extent data. It's in a weird format, but it did also have some gif images of the data.
I found another dataset I was interested in (LGM and Mid-Holocene Pollen-based Climate Reconstructions) and it's in NetCDF format, which can be tricky to work with, and probably a Python project, which might be worth doing. There were some good global LGM vegetation biome sets, in shapefile format. I think in the end, model-based reconstructions might be what I wind up digging into, but these so far seem to almost invariably be in NetCDF format (and therefore some work to visualize): https://www.ncei.noaa.gov/products/paleo...y/modeling
Screenshots that may be helpful:
Show Content
Spoiler

Show Content
Spoiler

Show Content
Spoiler

Posts: 137
Threads: 13
Joined: Oct 2023
Thanks. I (rarely) use QGIS, a bit much for the casual mapping, but since it is free fine. While I like to add some genetic info, building own maps from the supporting sciences like climatology would be a bit much for an outsider and I would like to rely on good sources. I will try to search the linked database.
This population density maps trough the last Ice Age are informative, but i is difficult to evaluate how much confidence can be put in the reconstruction. Unfortunate that West/Central Asia is not included as the Siberia and Middle East situation would certainly allow to see the overall refugiums impacting main pop expansions and Europe later better.
Quote:Human population dynamics in Europe over the Last Glacial Maximum
https://doi.org/10.1073/pnas.1503784112
Abstract
The severe cooling and the expansion of the ice sheets during the Last Glacial Maximum (LGM), 27,000–19,000 y ago (27–19 ky ago) had a major impact on plant and animal populations, including humans. Changes in human population size and range have affected our genetic evolution, and recent modeling efforts have reaffirmed the importance of population dynamics in cultural and linguistic evolution, as well. However, in the absence of historical records, estimating past population levels has remained difficult. Here we show that it is possible to model spatially explicit human population dynamics from the pre-LGM at 30 ky ago through the LGM to the Late Glacial in Europe by using climate envelope modeling tools and modern ethnographic datasets to construct a population calibration model. The simulated range and size of the human population correspond significantly with spatiotemporal patterns in the archaeological data, suggesting that climate was a major driver of population dynamics 30–13 ky ago. The simulated population size declined from about 330,000 people at 30 ky ago to a minimum of 130,000 people at 23 ky ago. The Late Glacial population growth was fastest during Greenland interstadial 1, and by 13 ky ago, there were almost 410,000 people in Europe. Even during the coldest part of the LGM, the climatically suitable area for human habitation remained unfragmented and covered 36% of Europe.
![[Image: pnas.1503784112fig02.jpeg]](https://www.pnas.org/cms/10.1073/pnas.1503784112/asset/b0555c41-4efa-4e7e-8ff7-481882ff87ed/assets/graphic/pnas.1503784112fig02.jpeg)
Simulated human population range and density compared with the spatial distribution of archaeological sites during six time intervals from 30 to 13 ky ago. Archaeological sites are indicated with black dots and in each time slice they represent sites dated within 1,000-y bins.
Posts: 51
Threads: 2
Joined: Sep 2023
Gender: Undisclosed
Y-DNA (P): R-M222 > R-BY198
mtDNA (M): U8a1a
Country: 
Yeah, that's all very fair. I think the NCEI database might end up being a bit technical and off-purpose, but there may be some useful bits in there. The majority of paleoclimatology research seems to focus not towards understanding living conditions of deep ancestors, but is aimed more at understanding, calibrating, and verifying how climate models perform in general, with a goal of improving predictions of future climate.
Those population maps are interesting. They mention that it performs worse in Siberia (which you can see in the 19ky map in particular), and in the Mediterranean, so I wonder if it also doesn't perform as well in West/Central Asia. SW Ireland also seems a little aggressive in 13ky, but I could be wrong there. The authors point out that the errors they noted are likely not due to climate modeling errors (and they compare to hi-res snapshot models), but rather human and/or archaeological factors, which makes sense.
|


![[Image: pnas.1503784112fig02.jpeg]](https://www.pnas.org/cms/10.1073/pnas.1503784112/asset/b0555c41-4efa-4e7e-8ff7-481882ff87ed/assets/graphic/pnas.1503784112fig02.jpeg)